5 Key Metrics Every ASX Investor Should Track
Numbers tell the story of a company. But with hundreds of data points in every ASX announcement, knowing which metrics actually matter is the difference between informed investing and information overload. Here are the five metrics that experienced ASX investors focus on — and how to find them in company filings.
1. Earnings Per Share (EPS)
Earnings per share is the single most important profitability metric for shareholders. It tells you how much profit a company generated for each share on issue. While total net profit matters, EPS adjusts for the number of shares outstanding — which means it accounts for dilution from capital raisings, share-based compensation, and other issuances.
When analysing ASX announcements, look at both statutory EPS (calculated under accounting standards) and underlying or adjusted EPS (which strips out one-off items). The difference between the two can reveal whether management is using adjustments to paint a rosier picture than the statutory numbers support. Compare current EPS to the prior corresponding period and to consensus estimates — the size and direction of any miss or beat often drives the share price reaction on the day.
Watch for: declining EPS despite rising revenue (margin compression), EPS growth driven primarily by share buybacks rather than organic profit growth, and large gaps between statutory and underlying EPS that may indicate recurring "one-off" charges.
2. Free Cash Flow (FCF)
Profit can be manipulated through accounting choices. Cash flow cannot. Free cash flow measures the actual cash a company generates after paying for its operations and capital expenditure. It tells you whether a company can fund dividends, repay debt, and invest in growth from its own resources — or whether it needs external funding.
On the ASX, free cash flow is particularly important for resource companies (where capital expenditure can be enormous), technology companies (where revenue growth may not yet translate to positive cash flow), and companies paying high dividend yields (where you want to know the dividend is funded by cash, not debt).
Calculate it as: operating cash flow minus capital expenditure. Both figures are found in the cash flow statement within the company's periodic reports. A company consistently generating positive free cash flow has options. A company burning cash needs to raise capital or cut spending eventually.
Watch for: free cash flow consistently below reported net profit (a sign that earnings quality may be poor), capital expenditure significantly above depreciation (the company is investing heavily, which may or may not pay off), and free cash flow yield (FCF divided by market cap) as an alternative valuation metric.
3. Net Debt and Gearing Ratio
Balance sheet strength determines whether a company can survive downturns and fund growth. Net debt (total borrowings minus cash and cash equivalents) and the gearing ratio (net debt divided by equity, or net debt divided by net debt plus equity) reveal how leveraged a company is.
On the ASX, this metric is especially relevant for property trusts (A-REITs), infrastructure companies, and any business with significant capital requirements. During periods of rising interest rates, highly geared companies face increasing interest costs that compress earnings. During downturns, excessive leverage can threaten solvency.
When reading ASX announcements, look for the net debt figure in the balance sheet summary (usually on the first few pages of a results announcement) and track how it changes over time. Also check the company's debt covenants — if gearing is approaching covenant limits, the company may be forced to raise equity or sell assets.
Watch for: net debt increasing faster than earnings (leverage building), refinancing risk (large debt maturities in the next 12 to 24 months), and covenant headroom (how much buffer exists before triggering lender restrictions).
4. Return on Equity (ROE)
Return on equity measures how efficiently a company uses shareholder capital to generate profit. Calculated as net profit divided by average shareholders' equity, ROE tells you whether management is creating value or destroying it. An ROE consistently above 15% generally indicates a quality business with competitive advantages. Below 10% suggests the company is not generating adequate returns on the capital invested.
On the ASX, ROE varies significantly by sector. Banks typically target ROE in the 10 to 12% range. Technology companies can achieve much higher ROE if they are asset-light. Resource companies fluctuate with commodity prices. Compare a company's ROE to its sector peers rather than to the market overall.
The DuPont decomposition breaks ROE into three components: profit margin (how profitable each dollar of revenue is), asset turnover (how efficiently assets generate revenue), and financial leverage (how much debt amplifies returns). This decomposition, available in most detailed results presentations, helps you understand whether high ROE is driven by genuine operational excellence or simply by financial engineering through leverage.
Watch for: ROE trending downward over multiple periods (deteriorating business quality), ROE primarily driven by leverage rather than margins (fragile returns), and ROE significantly above peers (investigate whether it is sustainable or cyclically elevated).
5. Dividend Payout Ratio and Yield
For income-focused investors — a significant portion of the ASX investor base including SMSF trustees — the dividend payout ratio and yield are essential metrics. The payout ratio (dividends per share divided by earnings per share) tells you what proportion of earnings is being returned to shareholders. The yield (annual dividends per share divided by the current share price) tells you the income return on your investment.
Australian companies are generally more generous with dividends than their global peers, partly due to the franking credit system. A fully franked dividend effectively increases the after-tax return for Australian resident shareholders. When evaluating ASX dividend stocks, always consider whether the dividend is fully franked, partially franked, or unfranked.
A payout ratio above 80 to 90% leaves little room for the company to absorb earnings dips while maintaining the dividend. A very high yield (significantly above the market average) may signal that the market expects the dividend to be cut — the yield is high because the share price has fallen in anticipation. Cross-reference the payout ratio with free cash flow to verify the dividend is cash-funded, not debt-funded.
Watch for: payout ratios above 100% (the company is paying more in dividends than it earns — unsustainable), dividend cuts or omissions flagged in results announcements, and changes in franking levels that affect after-tax returns.
Tracking These Metrics Efficiently
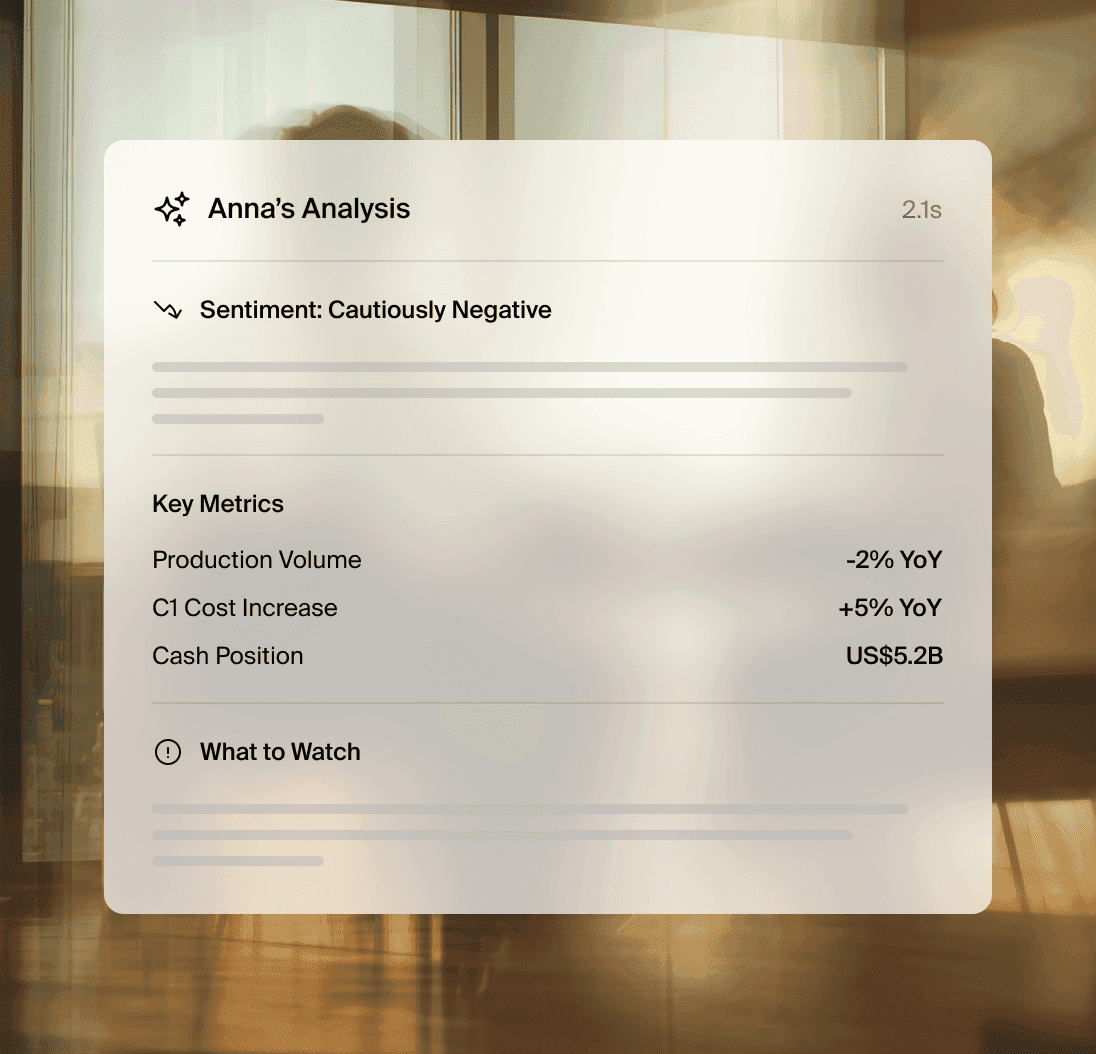
During reporting season, extracting these five metrics from every company in your portfolio requires reading dozens of lengthy PDF filings. AI-powered tools like Anna automate this process — reading every ASX announcement in real time and extracting the key financial metrics, guidance changes, and risk flags so you can focus on analysis rather than data gathering.
Whether you track these metrics manually or use AI assistance, the principle remains the same: focus on the numbers that reveal business quality, financial health, and shareholder value creation. Everything else is noise.
Explore more articles
Founded by traders. Engineered by humans. Designed for every investor.
© Anna 2025 - All Rights Reserved